Chorus v0.13.0: Turn Your Project Into a Mind-Map
Let a project run for a while and the pieces pile up. A handful of ideas, each with proposals hanging off it, each proposal split into documents and tasks, tasks depending on each other.
So when you want to know where the project actually stands, you page through everything. Tasks live on the board, ideas live in the idea list. But which proposal did this task come from, and which idea does that proposal answer to — the connected picture, you have to assemble in your head. The bigger the project, the less it holds together.
Chorus v0.13.0 gives every project a mind-map: ideas, proposals, documents, and tasks, wired into one tree automatically.
Generated From the Project’s Structure
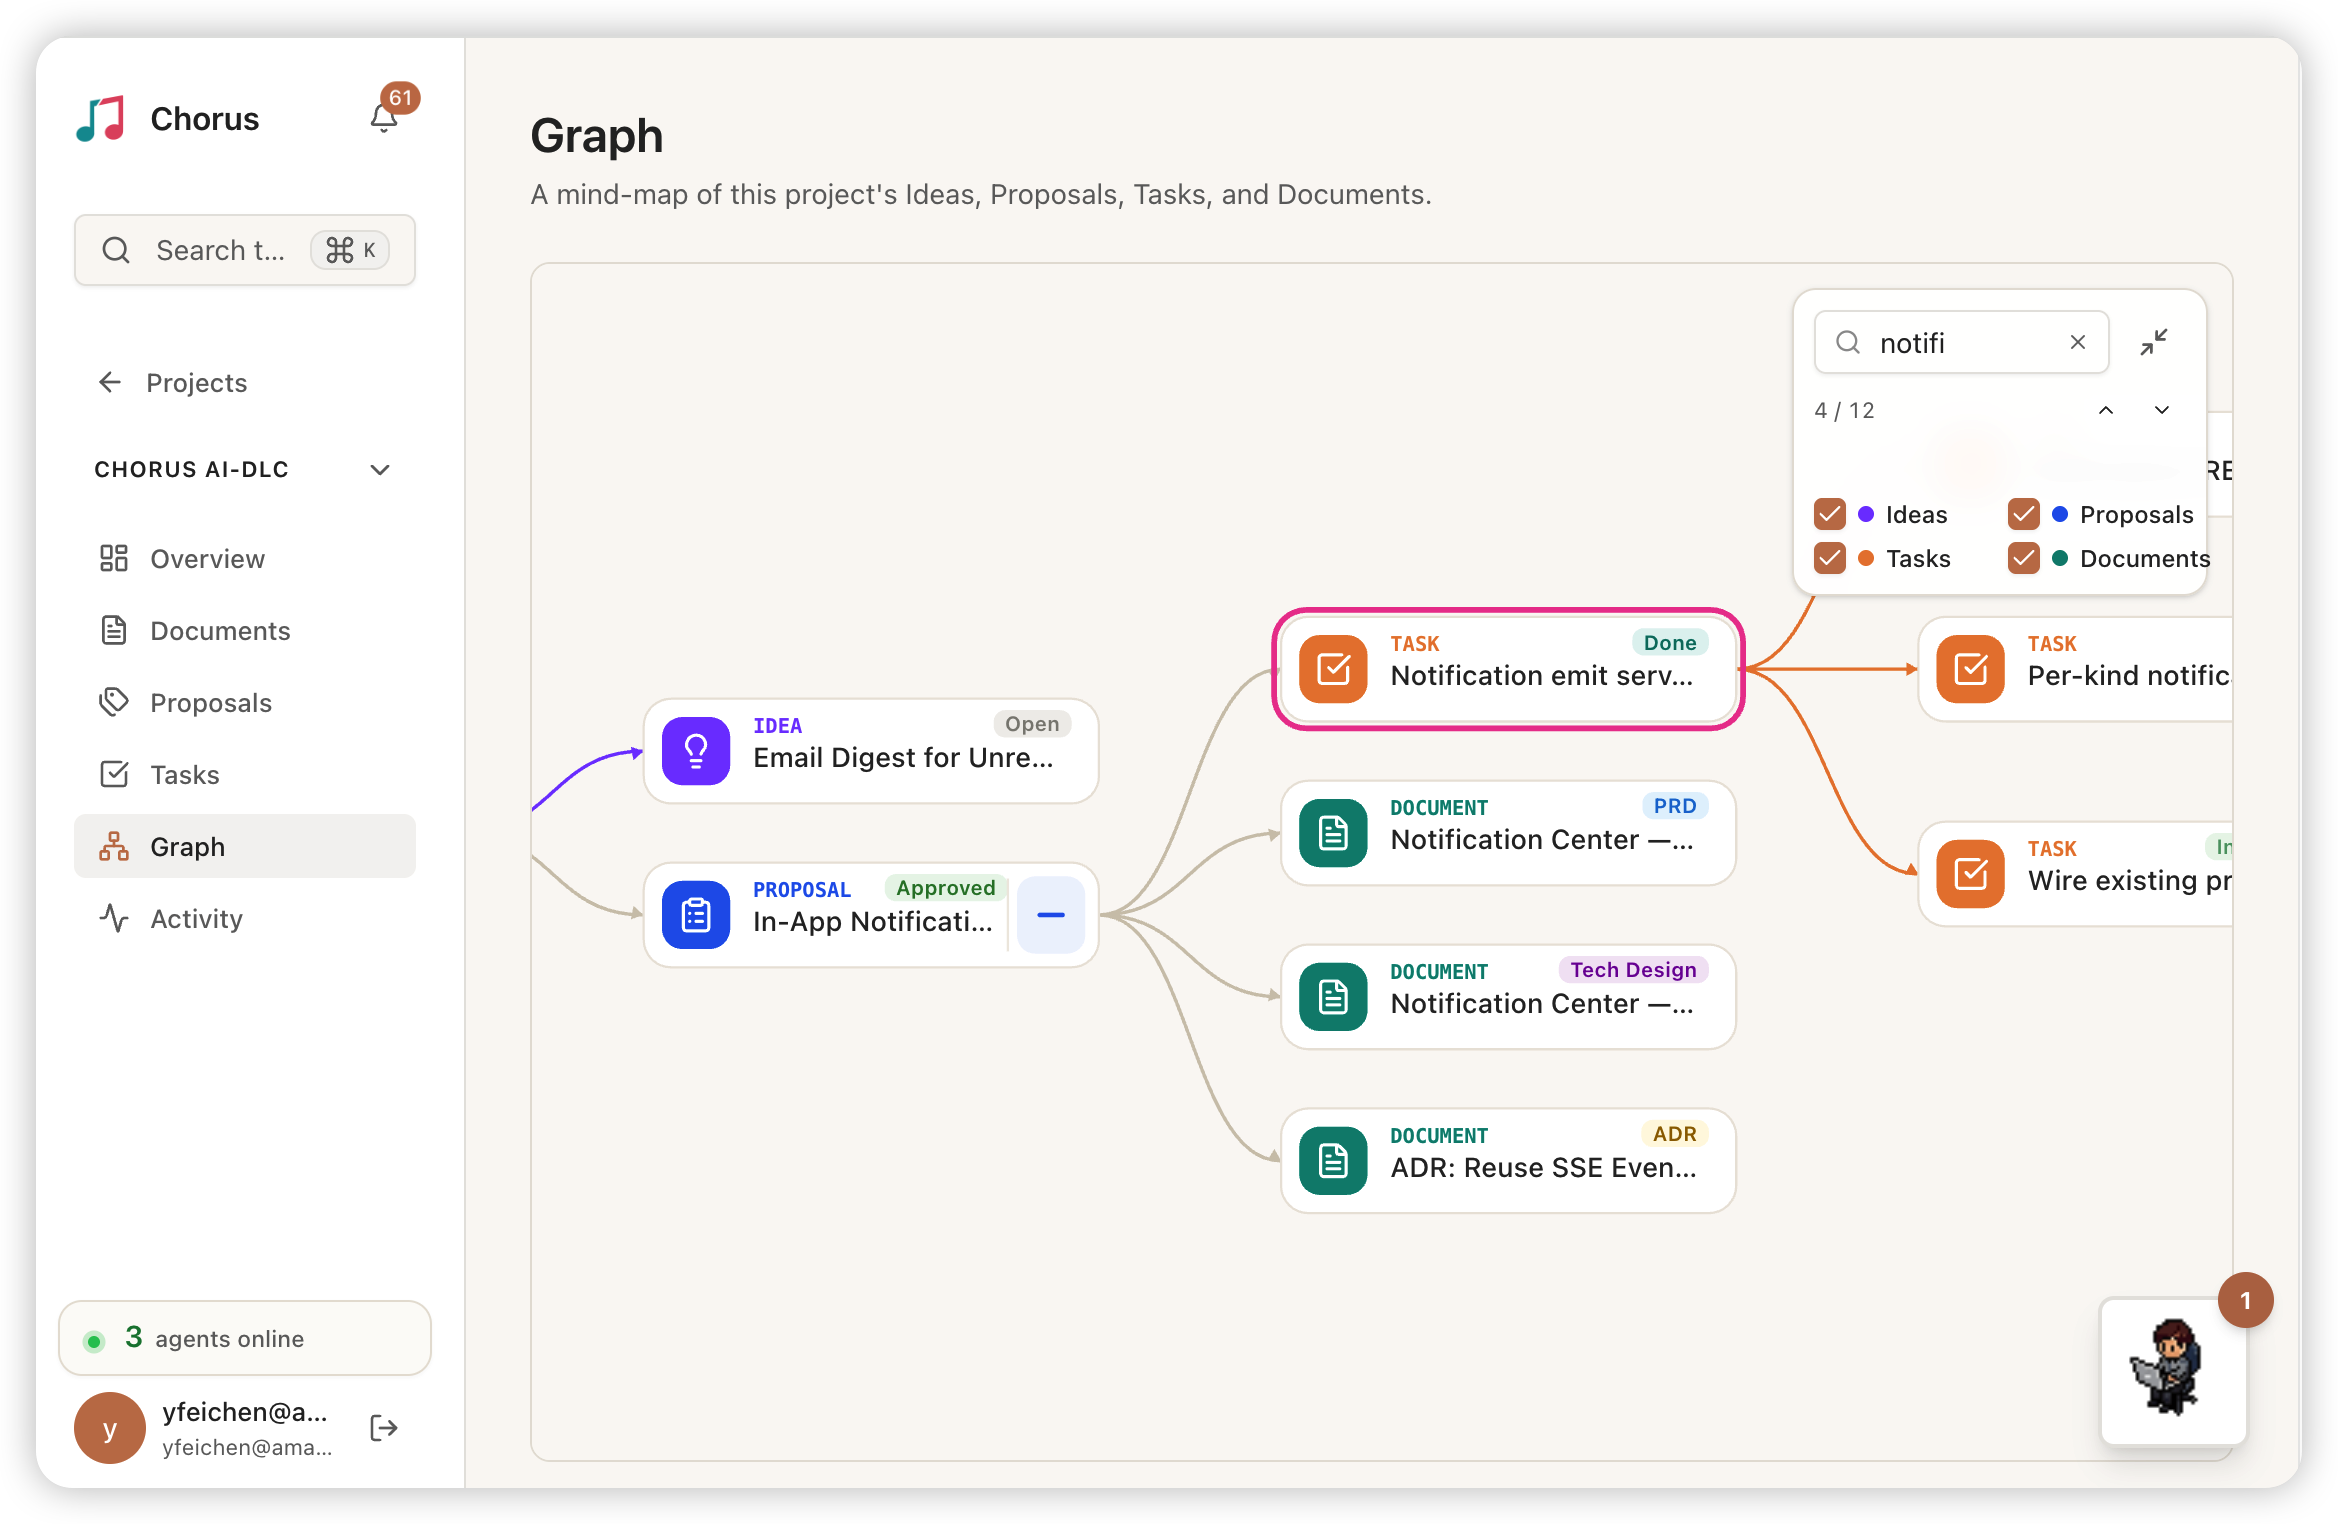
You don’t draw this tree — it follows the shape of the project itself. Ideas are the roots; proposals branch off them; below each proposal are the documents and tasks it produced, with the task-to-task dependencies drawn in too.
It starts collapsed. Each idea is the root of its own subtree, with a count of how many children are tucked underneath. You open one level at a time: expand an idea to see its proposals, expand a proposal to see its tasks and documents. Even a large project opens to a clean handful of ideas, and you drill into whichever branch you care about.
Every card also carries its current status. On an idea it’s the progress rolled up from its proposals and tasks; proposals and tasks each show their own. Scan the tree and you can see which idea is still being elaborated, which proposal got approved, which task is waiting on review — all on the card, without opening anything.
Search and Locate
Once a project is big and the nodes are many, finding one specific thing becomes the problem — especially when it’s tucked under some idea.
There’s a search box on the graph. Type part of a title and it auto-expands the path down to every match, surfacing even the deeply buried ones; matches light up, everything else dims. A current/total count sits alongside, with prev/next stepping that recenters the view on each hit. Clear the search and the expanded branches stay open — only the highlight and count go away, so you collapse whatever you want to on your own.
On the desktop, hovering a node floats the full title, so a truncated long one is still readable. On mobile the whole graph does two-finger pinch zoom and double-tap to zoom in or fit the tree. Desktop or phone, it’s the same graph you can zoom and drag.
The Whole Project at a Glance
Put it together and you have one place to see what a project looks like right now.
How many proposals an idea spawned, which got approved and which are still sitting; how far the tasks split out of a proposal have gotten, which one is blocking which. No paging around, no assembling it in your head — it’s all in front of you.
Upgrade
npx @chorus-aidlc/chorus@latestNo database migration this release. Once you upgrade, the “Graph” entry shows up in every project’s left navigation.
v0.13.0 is out on GitHub Releases and npm.
Questions or feedback? GitHub Issues or Discussions.
GitHub: Chorus-AIDLC/Chorus | Release: v0.13.0